Embeddings Analysis

Author

Haky Im

Published

April 23, 2025

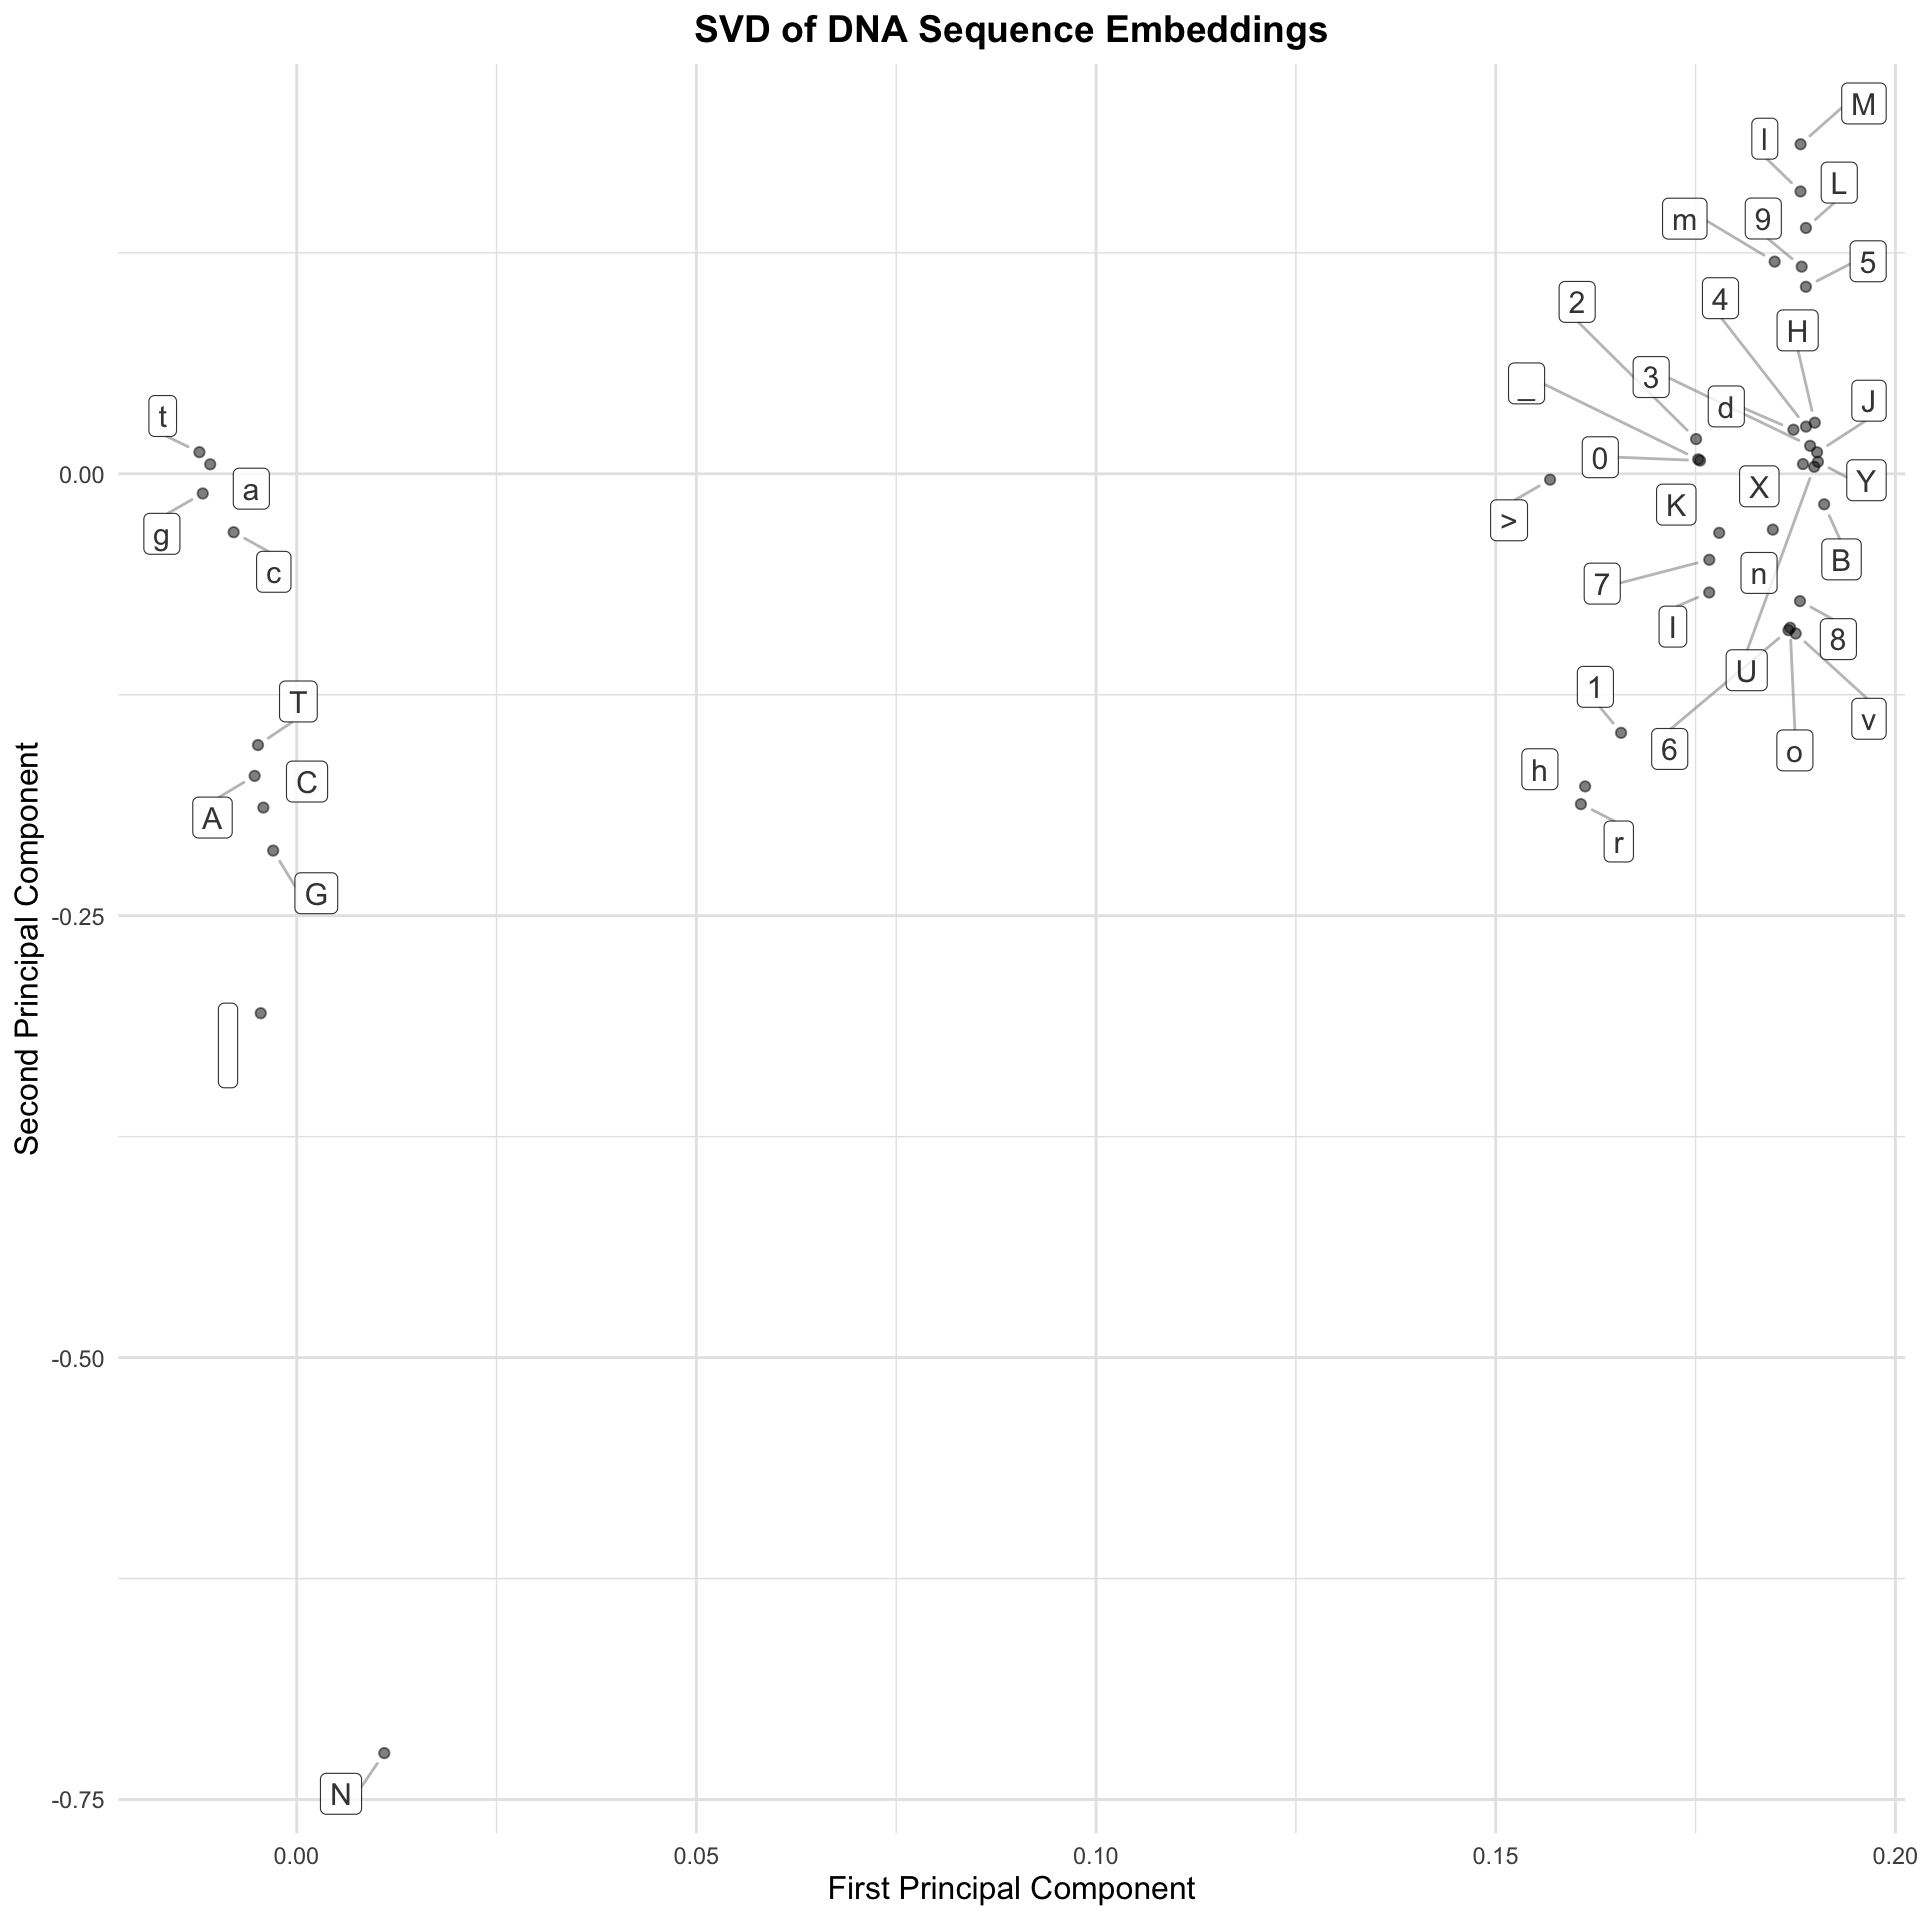
** embeddings provided by Henry from his DNA GPT model**

suppressMessages(library(tidyverse))
Warning: package 'purrr' was built under R version 4.3.3
Warning: package 'lubridate' was built under R version 4.3.3
suppressMessages(library(glue))
Warning: package 'glue' was built under R version 4.3.3
suppressMessages(library(ggrepel))
Warning: package 'ggrepel' was built under R version 4.3.3
# suppressMessages(library(qvalue))
# suppressMessages(library(devtools))
# suppressMessages(source_gist("38431b74c6c0bf90c12f")) ## get qqunif
# suppressMessages(library(googlesheets4))


WEBDATA = "/Users/haekyungim/Library/CloudStorage/Box-Box/LargeFiles/imlab-data/data-Github/web-data"

DATA = glue("{WEBDATA}/web-GENE-46100")

if(!file.exists(DATA)) system(glue::glue("mkdir {DATA}"))
##system(glue("open {DATA}")) ## this will open the folder 
embeddings = read_csv(glue("{DATA}/henry-dna-gpt-embed_df.csv.gz"))
New names:
Rows: 40 Columns: 385
── Column specification
──────────────────────────────────────────────────────── Delimiter: "," chr
(1): ...1 dbl (384): 0, 1, 2, 3, 4, 5, 6, 7, 8, 9, 10, 11, 12, 13, 14, 15, 16,
17, 18,...
ℹ Use `spec()` to retrieve the full column specification for this data. ℹ
Specify the column types or set `show_col_types = FALSE` to quiet this message.
• `` -> `...1`
names(embeddings)[1] = "token"

unique(embeddings$token)
 [1] "\n" "0"  "1"  "2"  "3"  "4"  "5"  "6"  "7"  "8"  "9"  ">"  "A"  "B"  "C" 
[16] "G"  "H"  "I"  "J"  "K"  "L"  "M"  "N"  "T"  "U"  "X"  "Y"  "_"  "a"  "c" 
[31] "d"  "g"  "h"  "l"  "m"  "n"  "o"  "r"  "t"  "v" 
svdfit = svd(embeddings[,-1])

ACGT cluster togeter, acgt also cluster together.

N is closer to ACGT and acgt, probably because of N appears more frequently than the remainig tokens.

png2file = FALSE

# if(png2file) png(glue("{DATA}/svd-plot.png"), width=1000, height=1000)
# plot(svdfit$u[,1], svdfit$u[,2], type="n", xlab="", ylab="", main="SVD of DNA sequence embeddings")
# text(svdfit$u[,1], svdfit$u[,2], embeddings$token, cex=1)
# if(png2file) dev.off()

# plot(svdfit$v[,1],svdfit$v[,2],type="n",xlab="",ylab="",main="SVD of DNA sequence embeddings")
# text(svdfit$v[,1],svdfit$v[,2],names(embeddings)[-1],cex=2)


# Create a data frame for plotting
plot_data <- data.frame(
  x = svdfit$u[,1],
  y = svdfit$u[,2],
  label = embeddings$token
)

# Create the plot
ggplot(plot_data, aes(x = x, y = y, label = label)) +
  geom_point(alpha = 0.5) +
  geom_label_repel(
    size = 4,
    max.overlaps = 20,
    box.padding = 0.5,
    point.padding = 0.5,
    segment.color = 'grey50',
    segment.alpha = 0.5,
    fill = "white",
    alpha = 0.8,
    label.size = 0.2
  ) +
  theme_minimal() +
  labs(
    title = "SVD of DNA Sequence Embeddings",
    x = "First Principal Component",
    y = "Second Principal Component"
  ) +
  theme(
    plot.title = element_text(hjust = 0.5, size = 14, face = "bold"),
    axis.title = element_text(size = 12),
    panel.grid = element_line(color = "grey90")
  )

# Save to file if needed
if(png2file) {
  ggsave(
    glue("{DATA}/svd-plot-ggplot.png"),
    width = 10,
    height = 10,
    dpi = 300
  )
}

© HakyImLab and Listed Authors - CC BY 4.0 License