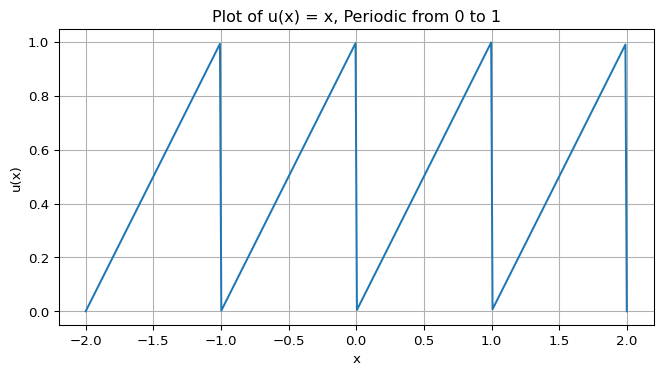
import numpy as npimport matplotlib.pyplot as pltdef u_periodic(x):""" Defines the periodic function u(x) = x with period 1, based on the interval [0, 1]. """# The modulo operator handles the periodicity. x % 1 gives the remainder of x divided by 1.# For positive x, this is the fractional part. For negative x, this gives a value# in the range (0, 1] or [-1, 0) depending on the implementation, but adding 1# and taking modulo 1 again ensures it's in [0, 1).return (x %1+1) %1# Generate x values from -2 to 2# We use a large number of points to get a smooth-looking plotx_values = np.linspace(-2, 2, 400)# Calculate the corresponding u(x) valuesy_values = u_periodic(x_values)# Plot the functionplt.figure(figsize=(8, 4))plt.plot(x_values, y_values)plt.title('Plot of u(x) = x, Periodic from 0 to 1')plt.xlabel('x')plt.ylabel('u(x)')plt.grid(True)plt.show()
---title: "Test"---# Test```{python}import numpy as npimport matplotlib.pyplot as pltdef u_periodic(x):""" Defines the periodic function u(x) = x with period 1, based on the interval [0, 1]. """# The modulo operator handles the periodicity. x % 1 gives the remainder of x divided by 1.# For positive x, this is the fractional part. For negative x, this gives a value# in the range (0, 1] or [-1, 0) depending on the implementation, but adding 1# and taking modulo 1 again ensures it's in [0, 1).return (x %1+1) %1# Generate x values from -2 to 2# We use a large number of points to get a smooth-looking plotx_values = np.linspace(-2, 2, 400)# Calculate the corresponding u(x) valuesy_values = u_periodic(x_values)# Plot the functionplt.figure(figsize=(8, 4))plt.plot(x_values, y_values)plt.title('Plot of u(x) = x, Periodic from 0 to 1')plt.xlabel('x')plt.ylabel('u(x)')plt.grid(True)plt.show()```i